The problem
Networks fail quietly. A switch drops offline at 2 a.m., a router's configuration gets changed by hand and never written down, or a service degrades slowly enough that nobody notices until a customer complains. Without visibility into device health, historical configuration, and service uptime, small issues turn into outages, and outages turn into forensic investigations with no data to investigate.
I designed and run a small, self-hosted observability stack that answers three questions continuously, for a network of 100+ switches and routers:
- Is every device up, and how is it performing?
- What did its configuration look like yesterday, last month, or before someone "fixed" it?
- Are the services running on top of that network actually reachable?
The three pieces
Device monitoring (LibreNMS)
Polls every switch and router on the network over SNMP, discovers the topology automatically (via CDP/LLDP neighbor discovery and BGP/OSPF routing peers), and tracks device health, CPU, memory, interface traffic, errors, uptime, over time. This is the "is the network healthy" layer.
Configuration backup (Oxidized)
Connects to every device on a schedule, pulls its running configuration, and commits it to a version-controlled history. If a configuration changes, intentionally or by mistake, there's a diff. If a device dies, its last known-good configuration is one git log away instead of being lost with the hardware. Over 200 backup revisions have been captured for this fleet so far.
Uptime and service checks (Uptime Kuma)
While LibreNMS watches the network layer, Uptime Kuma watches the services that depend on it, port reachability, ping response, SNMP-level checks, and grouped status dashboards, currently covering 200+ individual monitors. It's the layer that answers "can something actually reach this," which is a different question than "is the device technically up."
How they fit together
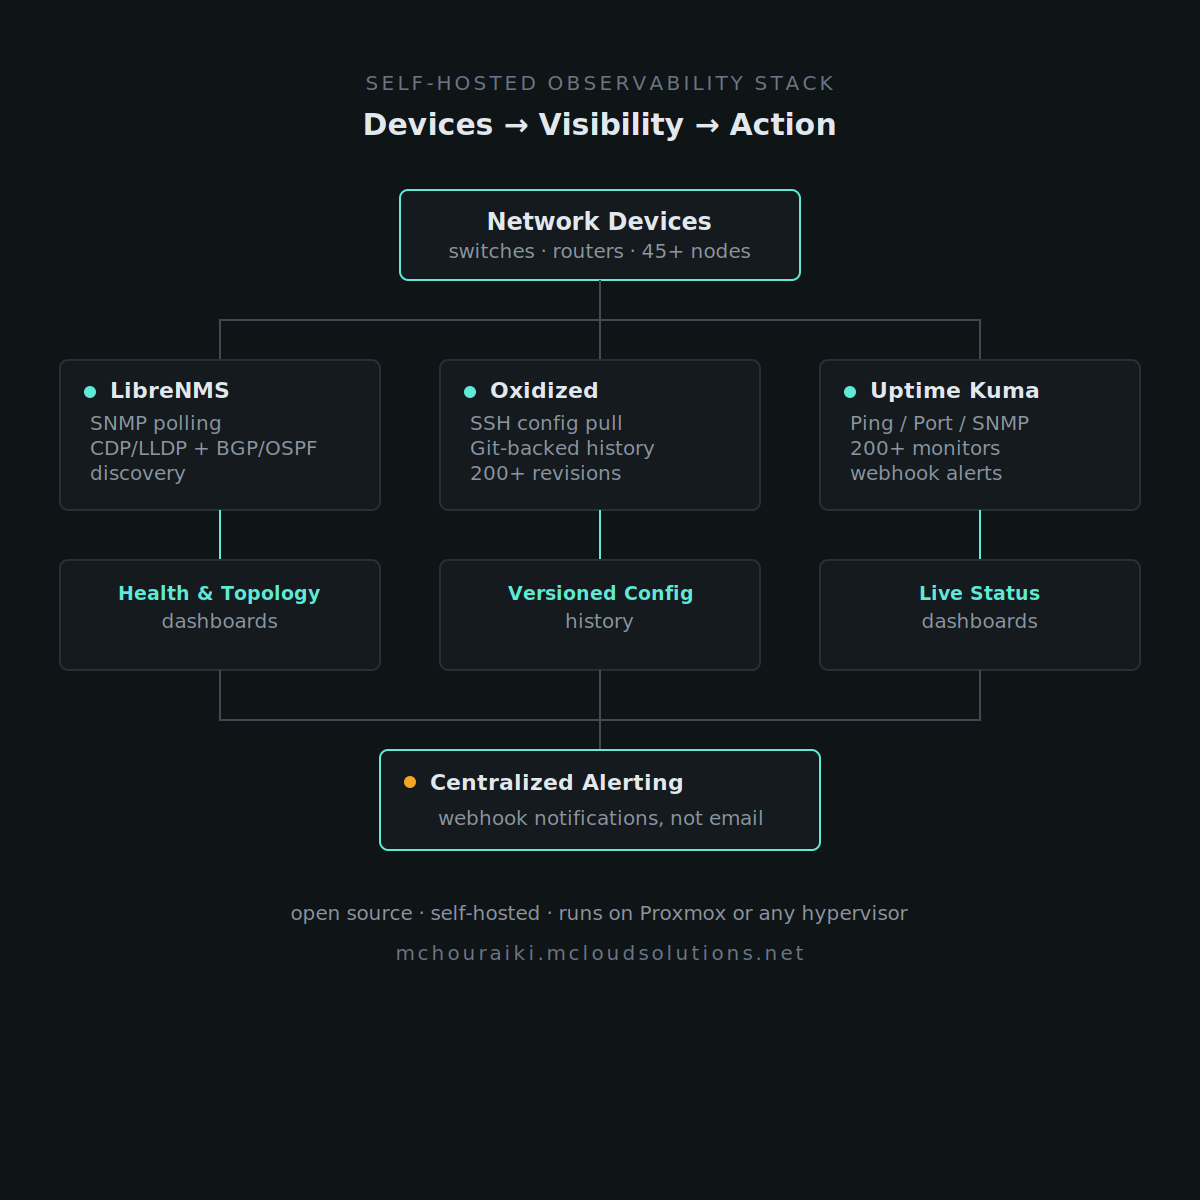
Each tool answers a question the others can't. LibreNMS tells you a device is unhealthy. Oxidized tells you what changed on it recently. Uptime Kuma tells you whether anything downstream actually noticed. Together they turn "the network feels slow" into a specific, evidence-backed answer.
Alerting is centralized through a chat-based notification channel, so a device going down or a configuration changing produces an immediate, actionable message rather than something discovered during a routine check-in.
Why self-hosted, open-source tools
All three components are open-source and run on commodity virtualization infrastructure (Proxmox). That keeps the stack auditable, avoids per-device licensing costs that scale badly with fleet size, and means the historical data, years of configuration history and uptime metrics, is owned outright rather than living behind a vendor's SaaS paywall.
Technical notes (for engineers)
- LibreNMS runs as a Docker Compose stack (poller, dispatcher,
syslog-ng,snmptrapd, Redis, MariaDB) inside an LXC container. Devices are polled over SNMPv2c. Discovery modules cover ARP tables, FDB, BGP/OSPF peers, and entity-physical inventory in addition to standard interface/CPU/memory polling. - Oxidized runs as a systemd service, pulling configs over SSH on an hourly interval and committing them to a local Git repository, which is then pushed to a remote for off-box redundancy. Devices are grouped by vendor and authentication profile via a CSV-based source file, rather than hardcoding per-device credentials in the main config.
- Uptime Kuma runs as a Node.js service backed by SQLite, with monitors organized into logical groups per dashboard. Notification delivery is webhook-based (chat platform integration) so alert routing doesn't depend on email deliverability.
- Both Oxidized and Kuma currently share a single VM. LibreNMS runs in its own LXC container, a deliberate separation so a heavy SNMP polling cycle can't starve the config-backup or alerting paths of CPU/IO.
- Device vendor mix in this deployment skews toward Cisco IOS/IOS-XE and Huawei VRP switching platforms, which is reflected in the Oxidized model/group mappings and the LibreNMS OS-detection breakdown.
Specific hostnames, IP ranges, and credentials are intentionally omitted from this writeup.